
Turn your data into one clear decision-ready view.
Mozon EagleEye is a business intelligence (BI) dashboard — a bilingual alternative to tools like Power BI — giving decision-makers real-time KPI tracking, permission-based panels, and instant exports, in Arabic and English.
Trusted by industry leaders across the region



Every KPI, on one
decision-ready screen.
Mozon EagleEye is a business intelligence platform that replaces scattered spreadsheets and delayed reports with live dashboards that decision-makers of every size can rely on.
Instant, automatic data updates.
Every panel and card refreshes the moment new data lands — no manual refresh, no stale numbers.
LIVEBilingual, natively.
Every panel, card and report is available in Arabic and English.
Permission-based visibility.
Panels and cards display according to each user's permissions.
Export however you need.
Send any panel out as an image, Excel file or PDF.
Build your own panels, no code required.
Design and adopt new panels and cards to fit your needs, with a minimum need to write code.
Real dashboards. Real decisions.
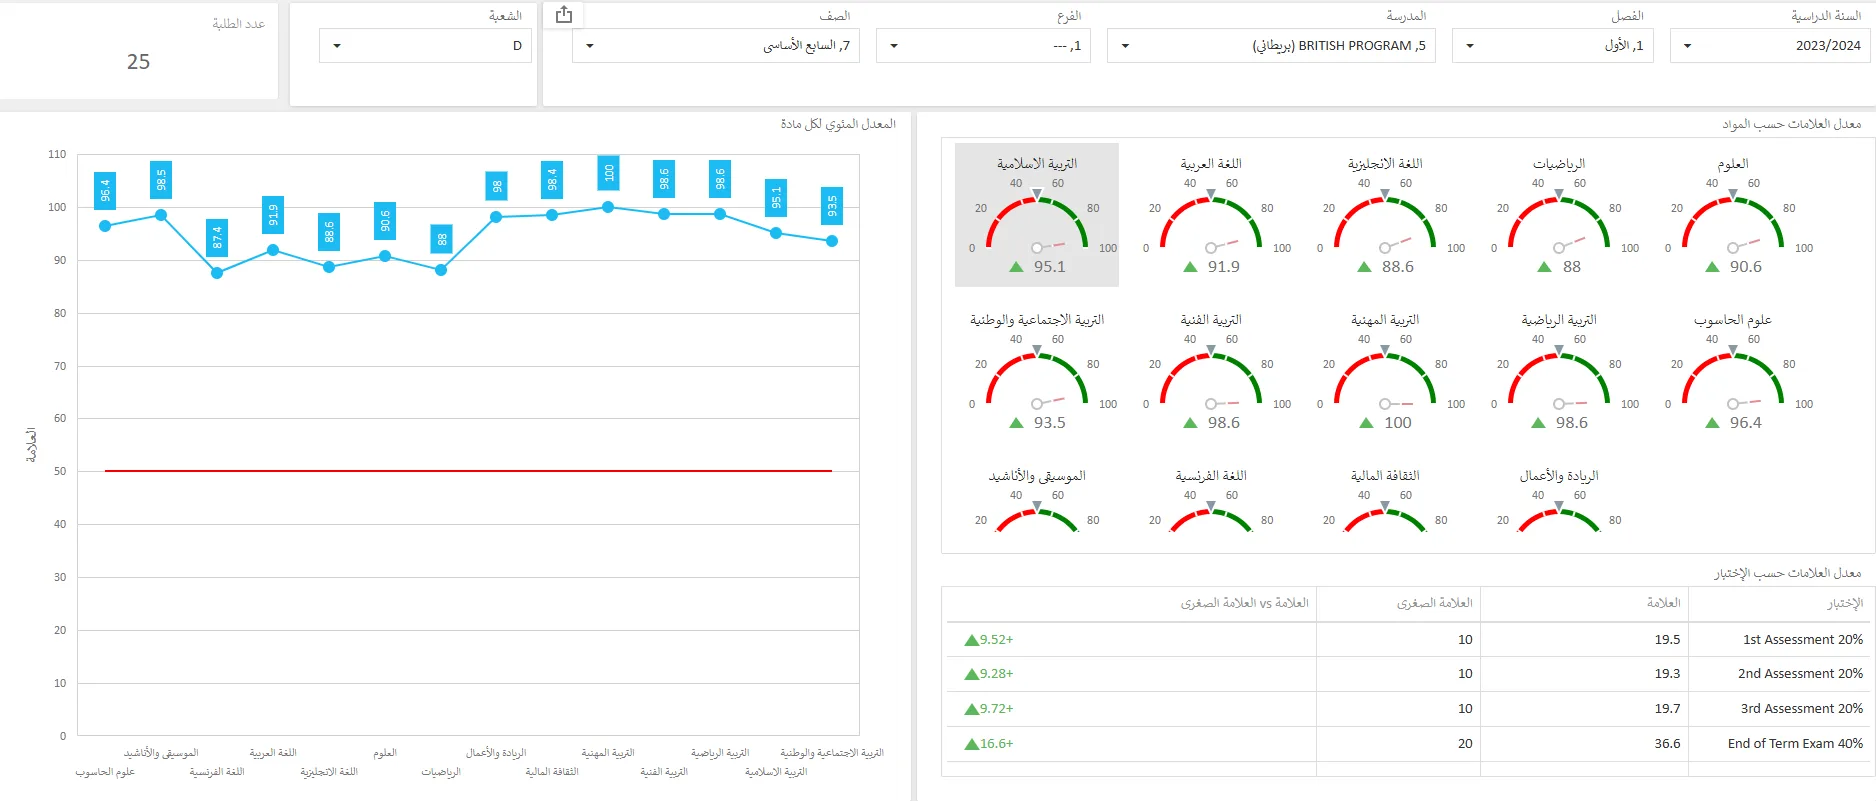
A look at the panels and cards Mozon EagleEye puts in front of decision-makers every day.
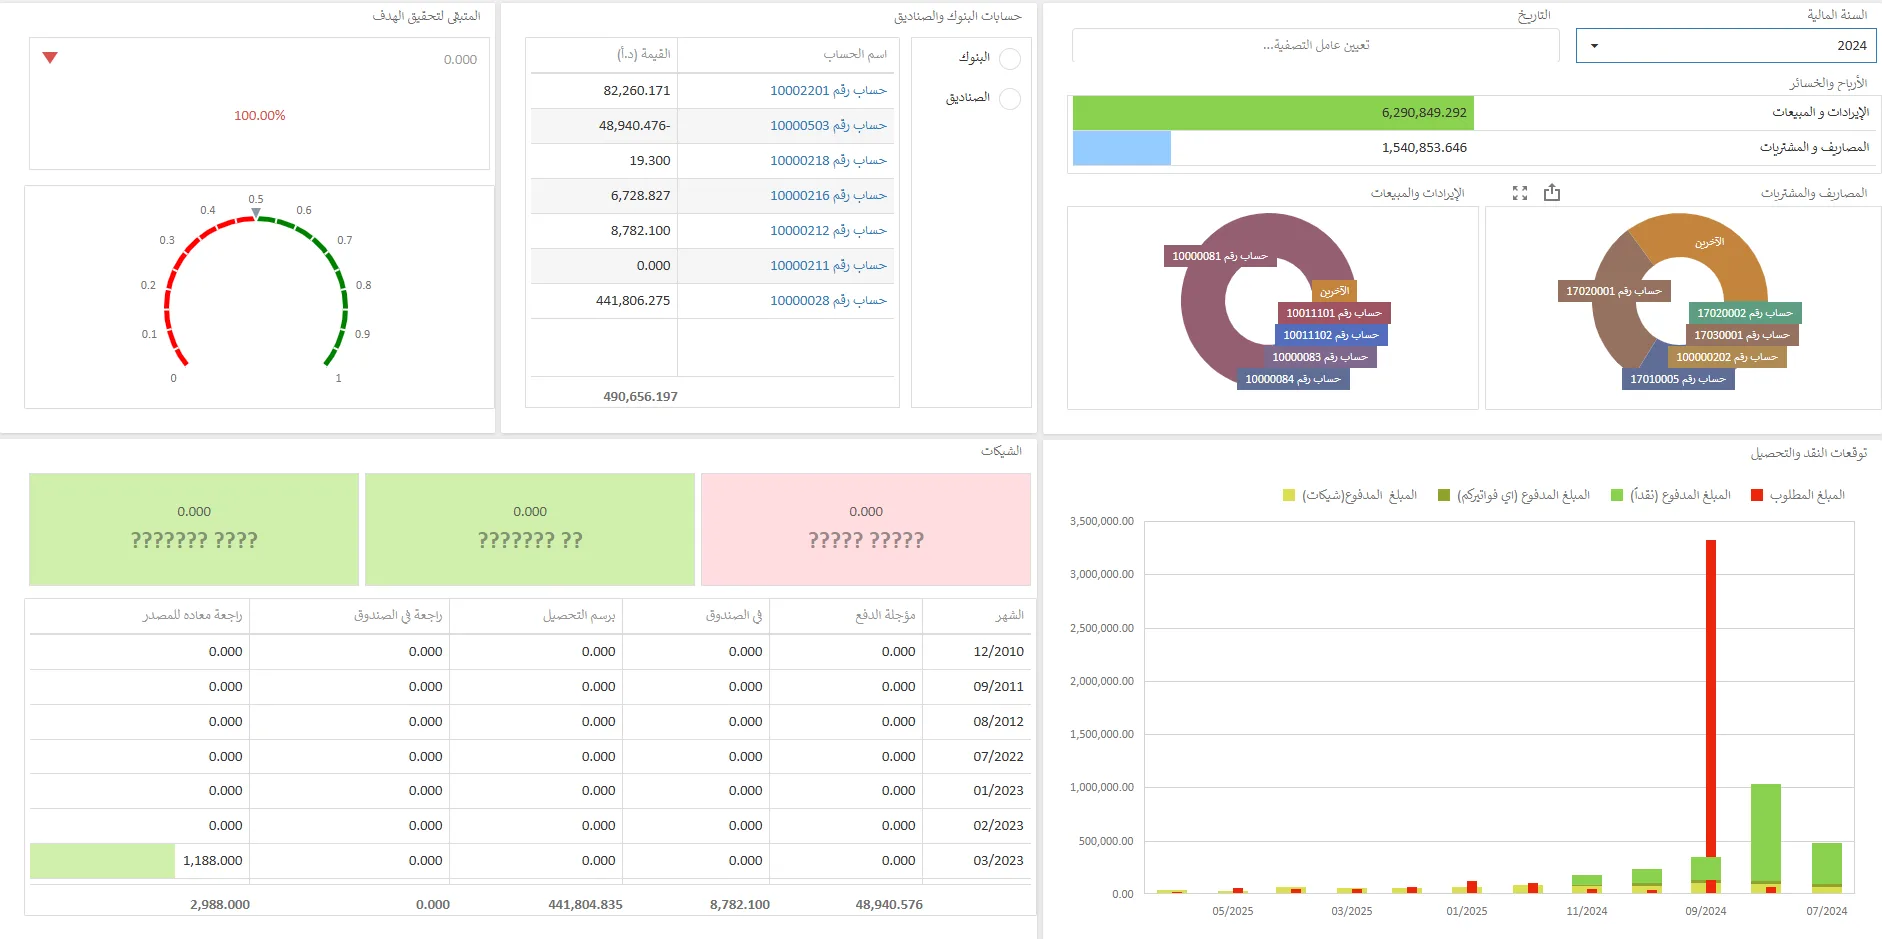
Five features. One business intelligence (BI) platform.
Everything a decision-maker needs to monitor KPIs, control access and export insights in the format they need.
Bilingual (Arabic and English)
Every panel, card and report available in both languages.
Panels and cards by user permissions
Each user sees only the panels their role allows.
Instant, automatic data updates
Panels and cards refresh the moment new data lands.
Export as image, Excel or PDF
Share any panel in the format your audience needs.
Design panels with minimal code
Build and adopt new panels and cards to fit your needs.
Support that acts like your in-house team.
Every Mozon customer gets a real engagement — not a ticket queue. Onboarding, training, tuning and long-term partnership come standard.
Free first-year maintenance
Included with every new deployment — no fine print.
On-site & remote support
Dedicated engineers reachable during working hours.
Full team training
Comprehensive sessions across every module you use.
SMS & WhatsApp messaging
Instant alerts and notifications over SMS and WhatsApp, keeping you connected with customers and your team.
Accounting consulting
Best practices from consultants who've seen it all.
Custom development
Tailor the system to workflows unique to your business.
Continuous updates
Periodic releases keep you compliant and ahead.
Guaranteed outcomes
We commit to results — not just installations.
Request tracking tools
Follow every ticket, change and improvement in one place.
Trusted by decision-makers and businesses of every size.
Mozon EagleEye supports businesses of every size across Jordan in monitoring performance and making informed decisions.

Frequently asked questions about Mozon EagleEye.
Answers to the questions we hear most from companies evaluating a KPI dashboard system.
What is Mozon EagleEye?
Mozon EagleEye is a business intelligence dashboard system for data analysis that gives decision-makers real-time visibility into their business information, with permission-based panels and instant exports.
Is a free demo available?
Yes, you can request a fully free live walkthrough with a Mozon EagleEye specialist to see the system before making any decision.
Does the system update automatically when new data arrives?
Yes, every panel and card in Mozon EagleEye refreshes the moment new data lands, with no manual update required.
Can panels be exported and shared?
Yes, you can export any panel in Mozon EagleEye as an image, an Excel file, or a PDF to share it in the format your audience needs.
Do different users see different panels?
Yes, panels and cards in Mozon EagleEye display according to each user's permissions, so everyone sees only what's relevant to them.
What support is included after go-live?
Every customer gets free first-year maintenance, on-site and remote support, full team training, and a long-term partnership — not just a one-time installation.
Ready to see everything at a glance?
Request a live walkthrough with a Mozon EagleEye specialist and see how KPIs, permissions and exports can run from one connected platform.